Urban Income Traps: High Salaries, Low Savings Potential
Big paycheck, small bank balance?
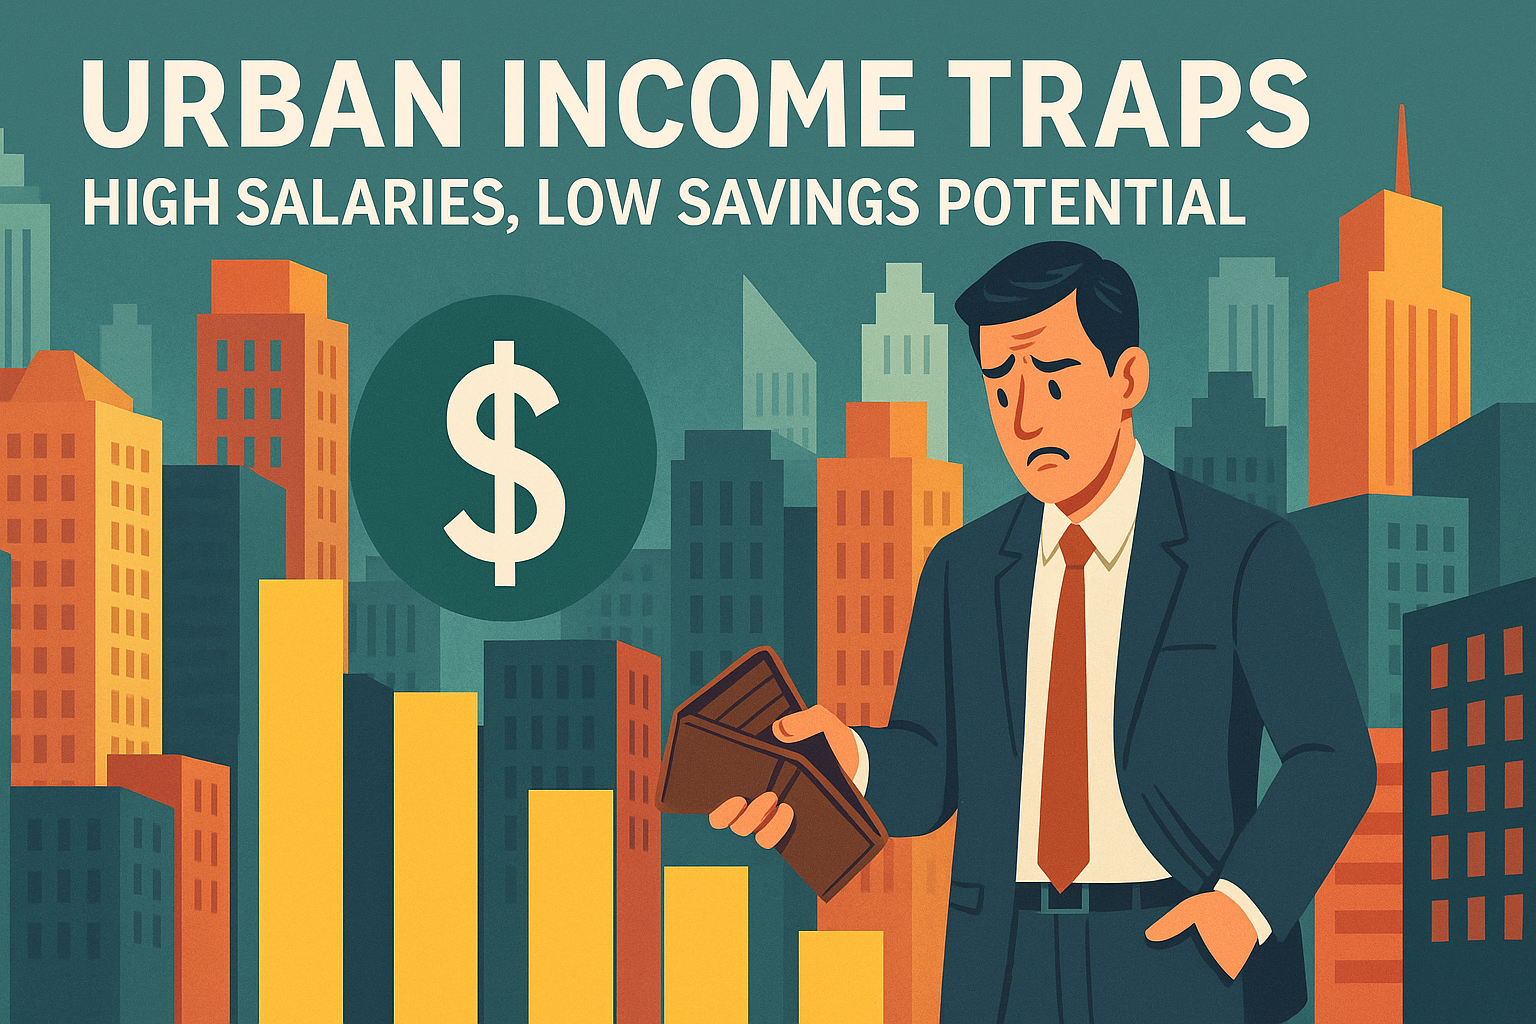
It’s a paradox many city dwellers face: they earn high salaries, yet struggle to save. In some global hubs, the cost of living, tax rates, and housing prices consume so much of your income that even a six-figure salary can feel tight.
This article exposes the urban income traps—cities where incomes are high on paper but provide surprisingly low real-world value.
What’s an Urban Income Trap?
An urban income trap occurs when your net income is quickly eroded by high living costs, housing, and local taxes, leaving little room for savings or discretionary spending.
What We Analyzed
To determine these traps, we reviewed:
- Net salary after tax (USD equivalent)
- Monthly rent (1BR apartment in city center)
- Basic living costs (groceries, transport, utilities)
- Effective savings potential
We looked at the financial experience of a single, working professional living alone. Data reflects 2025 monthly averages.
Urban Income Trap Index: Cities Where High Pay Doesn’t Translate to Wealth
| City | Net Salary | Rent (1BR) | Living Costs | Est. Savings Potential |
|---|---|---|---|---|
| San Francisco | $7,400 | $3,300 | $2,000 | ~$2,100 |
| London | $4,700 | $2,600 | $1,300 | ~$800 |
| Sydney | $4,300 | $2,100 | $1,400 | ~$800 |
| Toronto | $3,400 | $1,700 | $1,400 | ~$300 |
| New York City | $6,500 | $3,200 | $2,100 | ~$1,200 |
| Tokyo | $3,300 | $1,400 | $1,300 | ~$600 |
| Paris | $3,600 | $1,850 | $1,200 | ~$550 |
| Dublin | $4,200 | $2,300 | $1,400 | ~$500 |
| Oslo | $4,500 | $2,400 | $1,500 | ~$600 |
| Amsterdam | $4,000 | $2,000 | $1,400 | ~$600 |
Why These Cities Are Financial Traps
1. Housing Costs
In nearly all cities above, rent consumes 40–55% of net income, drastically reducing your ability to save or invest.
- NYC: 49% of net salary goes to rent
- Dublin: 55%
- Toronto: 50%
2. Tax Burden
Progressive income taxes, national insurance, and local levies reduce gross income by 25–45%, depending on location.
- London: ~38% effective tax rate
- Oslo: ~42%
- Paris: ~35%
3. Cost of Essentials
Utilities, groceries, and public transport in global capitals are consistently high.
- Tokyo and Paris rank among the most expensive for daily living
- Public transit in Oslo, Dublin, and Sydney is reliable—but not cheap
But I Thought These Were “Rich Cities”?
They are. But income ≠ wealth accumulation.
These cities offer:
- Strong job markets
- High salaries in finance, tech, consulting
- Advanced infrastructure
But the premium comes with a price.
What You Could Be Saving in Other Cities
Let’s compare with cities known for better salary-to-cost ratios:
| City | Net Salary | Rent (1BR) | Living Costs | Savings Potential |
|---|---|---|---|---|
| Kuala Lumpur | $2,900 | $600 | $900 | ~$1,400 |
| Tbilisi | $2,000 | $450 | $800 | ~$750 |
| Buenos Aires | $2,100 | $350 | $750 | ~$1,000 |
| Bangkok | $2,800 | $700 | $850 | ~$1,250 |
These cities may offer lower salaries, but they allow remote workers or location-flexible earners to retain more of what they earn.
Remote Work Is the Escape Hatch
A major shift is underway:
- Professionals are leaving high-cost cities and earning globally, spending locally
- Remote-first firms are allowing employees to live in lower-cost regions
- Visa programs for digital nomads are expanding in places like Portugal, Thailand, and Malaysia
Who Should Care?
- Young professionals burning through income without building wealth
- Remote workers seeking better value per dollar
- Mid-career earners considering relocation or early retirement
- Global entrepreneurs wanting to reduce personal burn rate
How to Avoid the Trap
Use our tools to help chart a smarter financial path:
- 🧭 City Comparison Tool: Side-by-side data for income, rent, crime, tax, and more
- 💸 Take-Home Pay Calculator: See what you really earn after tax
- 🌍 Visa Eligibility Checker: Find countries you can live and work in legally
Final Takeaway
A high salary is no longer enough. The smart move in 2025 is to optimize for net gain, not prestige zip codes.
If your paycheck disappears the moment it arrives, you might be living in an urban income trap.
Rethink location. Redefine wealth. Reclaim your income.